
Solved UPSC CDS/OTA Question
A solved UPSC CDS/OTA PYQ - decoded step-by-step.
Solve it the standard way once - then learn the shortcut.
Q · Data InterpretationMedium · 45s
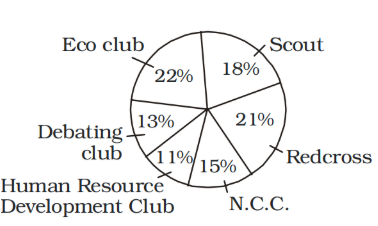
The pie-chart given below shows the number of students enrolled in a school in different activities. Total number of students in the school is 1200. Study the chart and answer the questions. What is the ratio of number of students enrolled in Scout and Redcross activities together to those enrolled in Debating Club activities ?
TopicData Interpretation
Question Typemultiple choice
DifficultyMedium
Marking+1 / −0.33
Test Duration30 min
Step-by-Step Solution
The complete worked solution.
Every step explained - no skipped algebra.
Required ratio
= (18 + 21) : 13
= 39 : 13 = 3 : 1
Final Answer: Option A - 3 : 1