
Solved UPSC CDS/OTA Question
A solved UPSC CDS/OTA PYQ - decoded step-by-step.
Solve it the standard way once - then learn the shortcut.
Q · Data InterpretationMedium · 45s
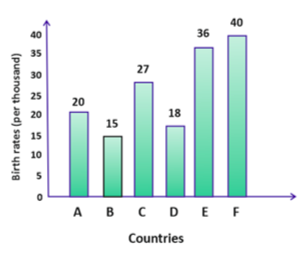
Direction: The following bar chart represents the birth rate (Per thousand) of six different countries. Study the bar chart and answer the question given below. The birth rate of country E is what per the birth rate of country A?
TopicData Interpretation
Question Typemultiple choice
DifficultyMedium
Marking+1 / −0.33
Test Duration30 min
Step-by-Step Solution
The complete worked solution.
Every step explained - no skipped algebra.
Birth rate of country A = 20
Birth rate of country E = 36
Required percentage = 36/20 × 100 = 180%
Final Answer: Option B - 180%