
Limited-time offerGet up to 75% OFFGrab the offer
Data Interpretation · UPSC CDS/OTA · Question 42 of 55

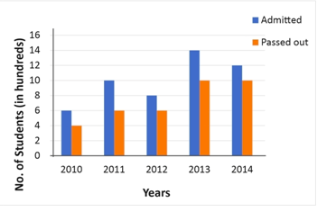
Data Interpretation: Direction: The bar graph shows the number of students (in hundreds) admitted and passed out per year in a college during the years 2010 to 2014. Study the bar-graph and answer the question. The ratio of the number of students admitted in the year 2012 to the average number of students passed out in the years 2013 and 2014 is

Step-by-step solution. Data Interpretation for UPSC CDS/OTA.

Topic
Data Interpretation
Subject
Mathematics
Difficulty
Medium
Solve Time
45-60 sec

Solved UPSC CDS/OTA Question

A solved UPSC CDS/OTA PYQ - decoded step-by-step.

Solve it the standard way once - then learn the shortcut.

Q · Data InterpretationMedium · 45s

Direction: The bar graph shows the number of students (in hundreds) admitted and passed out per year in a college during the years 2010 to 2014. Study the bar-graph and answer the question. The ratio of the number of students admitted in the year 2012 to the average number of students passed out in the years 2013 and 2014 is:
Question illustration 1
TopicData Interpretation
Question Typemultiple choice
DifficultyMedium
Marking+1 / −0.33
Test Duration30 min

Step-by-Step Solution

The complete worked solution.

Every step explained - no skipped algebra.
Solution illustration 1
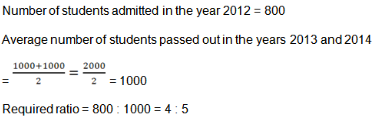
Final Answer: Option A - 4 : 5
Solve Question✦ Build Plan
Direction: The bar graph shows the number of students… - Data Interpretation (Mathematics) Solved Question