Solved UPSC CDS/OTA Question
A solved UPSC CDS/OTA PYQ — decoded step-by-step.
Solve it the standard way once — then learn the shortcut.
Q · Data InterpretationMedium · 45s
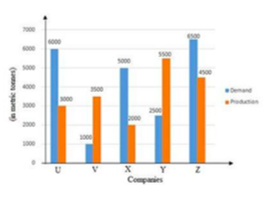
Direction: Study the graph and answer the question that follows. The chart represents the demand and production of a certain item ( in metric tonnes) for five companies U, V, X, Y and Z. If p% of the demand of the item for company U is equal to the production for company Z, then p is equal to:
TopicData Interpretation
Question Typemultiple choice
DifficultyMedium
Marking+1 / −0.33
Test Duration30 min
Step-by-Step Solution
The complete worked solution.
Every step explained — no skipped algebra.
Given demand of the item for company U
Production for company Z = 4500
According to the question,
P% of 6000 = 4500
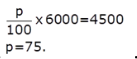
Final Answer: Option D — 55