Solved UPSC CDS/OTA Question
A solved UPSC CDS/OTA PYQ — decoded step-by-step.
Solve it the standard way once — then learn the shortcut.
Q · Data InterpretationMedium · 45s
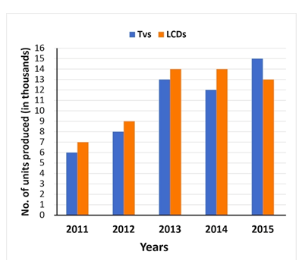
Direction: Study the following bar diagram and answer the question that follows. The production (in thousands) of electronic items (TV and LCD) in a factory during the period from 2011 to 2015 The difference between the average production of LCDs and that of TVs from 2011 to 2013 is:
TopicData Interpretation
Question Typemultiple choice
DifficultyMedium
Marking+1 / −0.33
Test Duration30 min
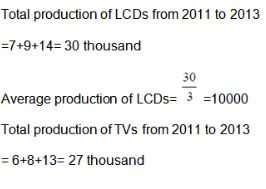
Step-by-Step Solution
The complete worked solution.
Every step explained — no skipped algebra.
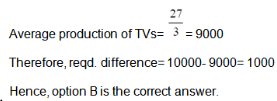
Final Answer: Option B — 1000